Large Hurricane Analysis - Outage
top_15_outage.RmdProgram Background
Script name: Large Hurricane Analysis - Outage
Project name: ADRD and Hurricane Exposure
-
Program description:
Outage measure calculation for 15 previously selected large hurricanes. Only hurricanes in 2014 and after had available outage data.
Number of customers without electricity is collected by EAGLE-I. County-level electric customer estimates are generating by adding the census business survey and ACS5 population estimates for a county and normalizing to state-wide energy customer estimates from the Energy Information Administration.
-
Data:
ACS 5 - through
tidycensuspackageHURDAT2 - to get storm dates
Restrictions:
-
Outline of program/analysis:
Specify all storms
Download and process hurdat2 tracks
Extract outage data for dates specified by the HURDAT2 plus 2 days after
Calculate outage estimates for the maximum percentage of customers without electricity and the average duration of outages
Crosswalk county estimates to ZCTA using 2010 ZCTA to County Relationship file
Author: Ryan Zomorrodi
Revisions
-
Input files
- All files are downloaded using R functions
- Cache is stored in
raw-data\eaglei
-
Output files
tract/{storm id}/outage.csv-
zcta/{storm id}/outage.csvColumn Description geoid2010 geographic identifier max_pct_outMaximum percentage of customers out of electricity at any point avg_customer_hrs_outAverage number of hours each customer was out of electricity for
Start Time
The following hurricanes were selected.
hur_info <- readRDS( "raw-data/RF1_Hurricanes_Final.rds")
# get fips codes for each state
fips_codes <- distinct(tigris::fips_codes, state, state_code)
hur_info$fips <- pmap(hur_info, function(states, ...) {
  fips_codes$state_code[match(states, fips_codes$state)]
})
Get hurdat2 info for each storm
exposhur:::download_newest_hurdat2(path = "raw-data/hurdat2")

hur_info$hurdat2 <- pmap(hur_info, function(hurricane, ...){
  hurdat  <- get_hurdat2(
    storm_id = hurricane,
    path = "raw-data/hurdat2"
  )

  list(
    start_date = min(hurdat$datetime),
    end_date = max(hurdat$datetime),
    hurdat = hurdat
  )
})
hur_info <- unnest_wider(hur_info, hurdat2)Calculate outage
hur_info$outage <- pmap(hur_info, function(eaglei, fips, start_date, ...) {
  if (year(start_date) < 2014) {
    return(list(NULL))
  }

  calc_outage(eaglei, fips)
})

pwalk(hur_info, function(outage, hurricane, start_date, ...) {
  if (year(start_date) >= 2014) {
    write_csv(outage, str_c("tract/", hurricane, "/outage.csv"))
  }
})
Crosswalk to zctas
zcta_to_county <- read_csv("https://www2.census.gov/geo/docs/maps-data/data/rel/zcta_county_rel_10.txt") %>%
  mutate(geoid_z = str_c(STATE, ZCTA5)) %>%
  mutate(geoid_c = str_c(STATE, COUNTY))

outages <- Sys.glob("tract/*/outage.csv") %>%
  map(function(outage_path) {
    outage <- read_csv(outage_path, col_types = cols(geoid = col_character()))

    outage %>%
      left_join(zcta_to_county, join_by(geoid == geoid_c)) %>%
      group_by(geoid_z) %>%
      summarise(
        max_pct_out_xwalk = sum(ZPOPPCT * max_pct_out) / 100,
        avg_customer_hrs_out_xwalk = sum(ZPOPPCT * avg_customer_hrs_out) / 100
      )

    outage %>%
      write_csv(str_replace(outage_path, "tract", "zcta"))
  })
End Time
Visualizations
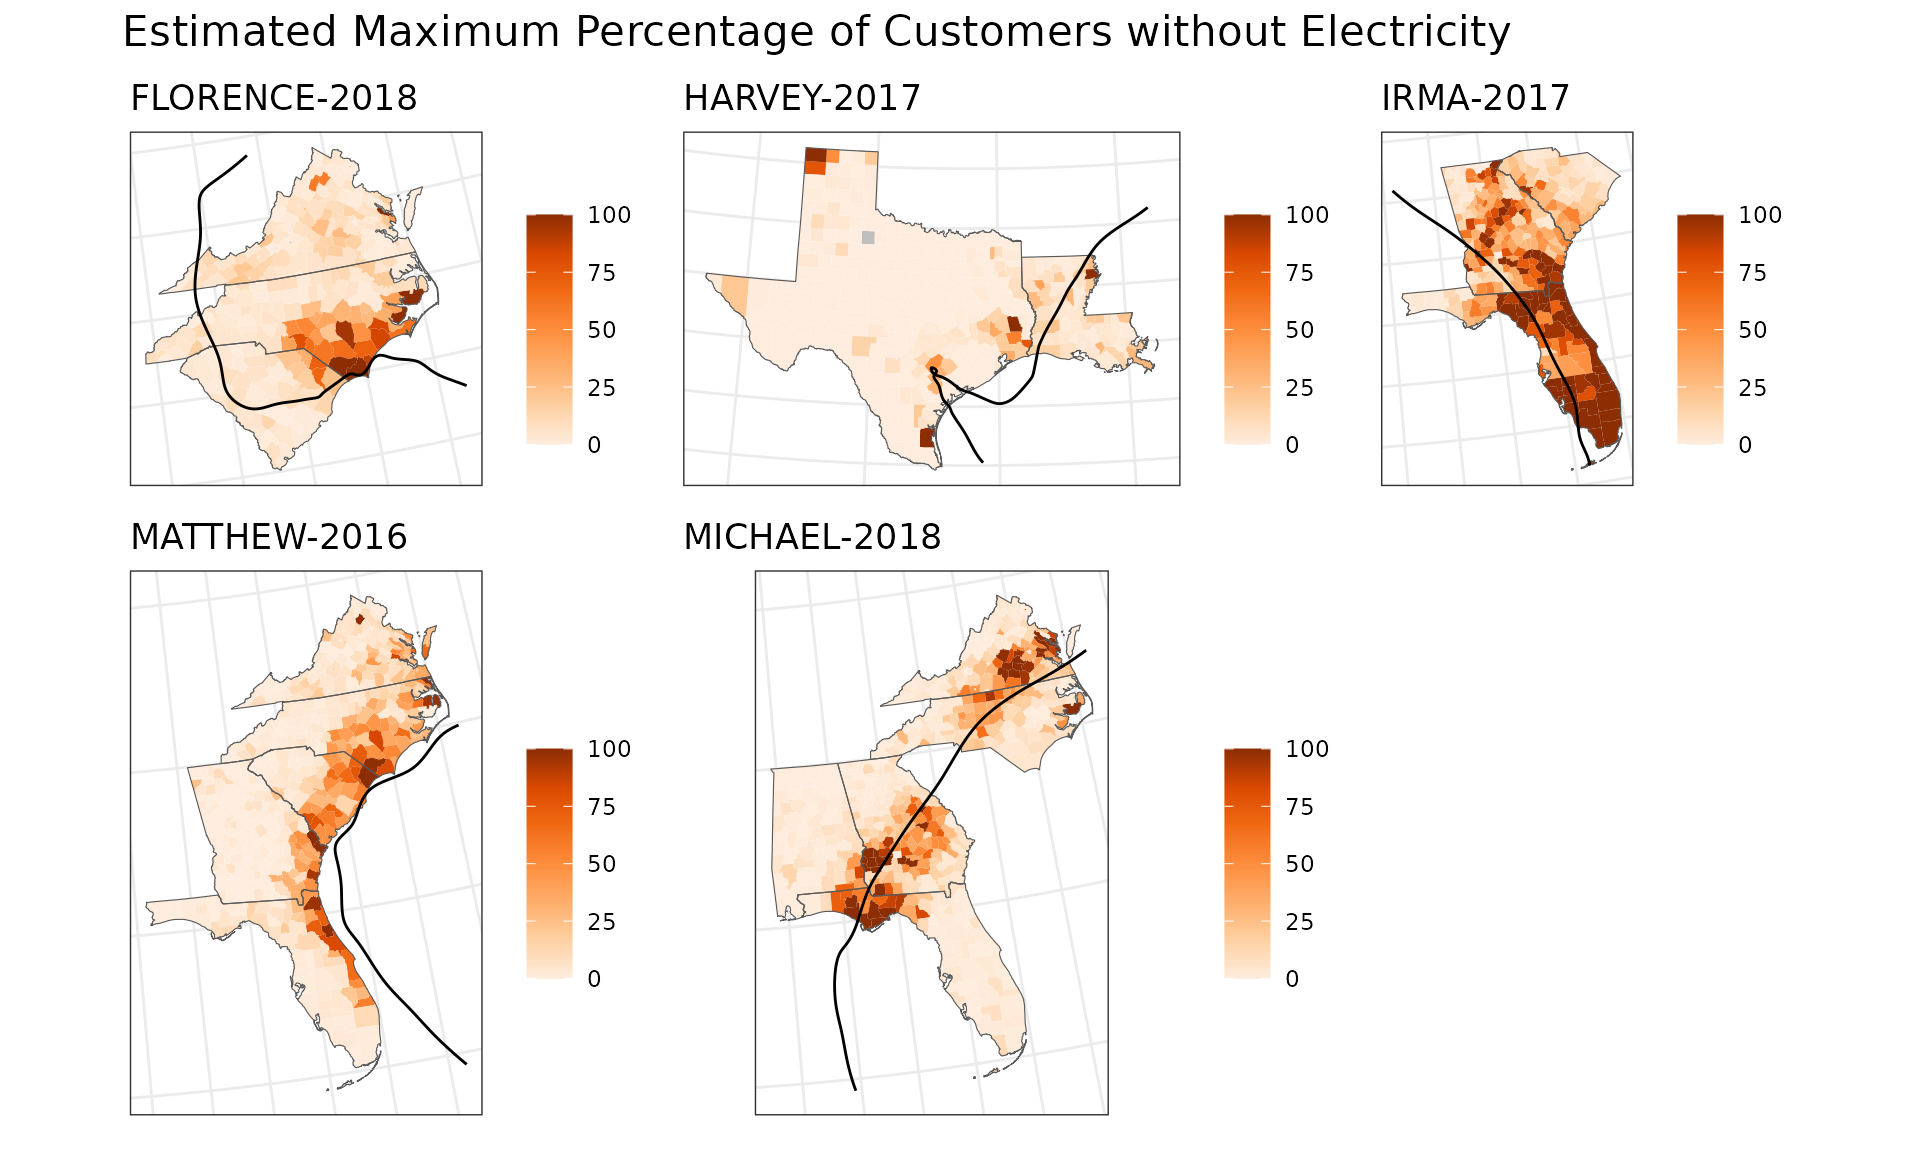
| Estimated Maximum Percentage of Customers without Electricity | ||||||||
| Storm | Mean | SD | Min | 25% Quantile | Median | 75% Quantile | Max | Distribution |
|---|---|---|---|---|---|---|---|---|
| FLORENCE-2018 | 12.702 | 20.705 | 0 | 2.061 | 5.185 | 11.571 | 100 | |
| HARVEY-2017 | 5.829 | 14.774 | 0 | 0.000 | 0.317 | 4.069 | 100 | |
| IRMA-2017 | 46.973 | 35.085 | 0 | 13.798 | 38.251 | 79.503 | 100 | |
| MATTHEW-2016 | 14.535 | 22.314 | 0 | 0.711 | 3.642 | 19.851 | 100 | |
| MICHAEL-2018 | 20.905 | 29.487 | 0 | 1.390 | 6.355 | 28.729 | 100 | |
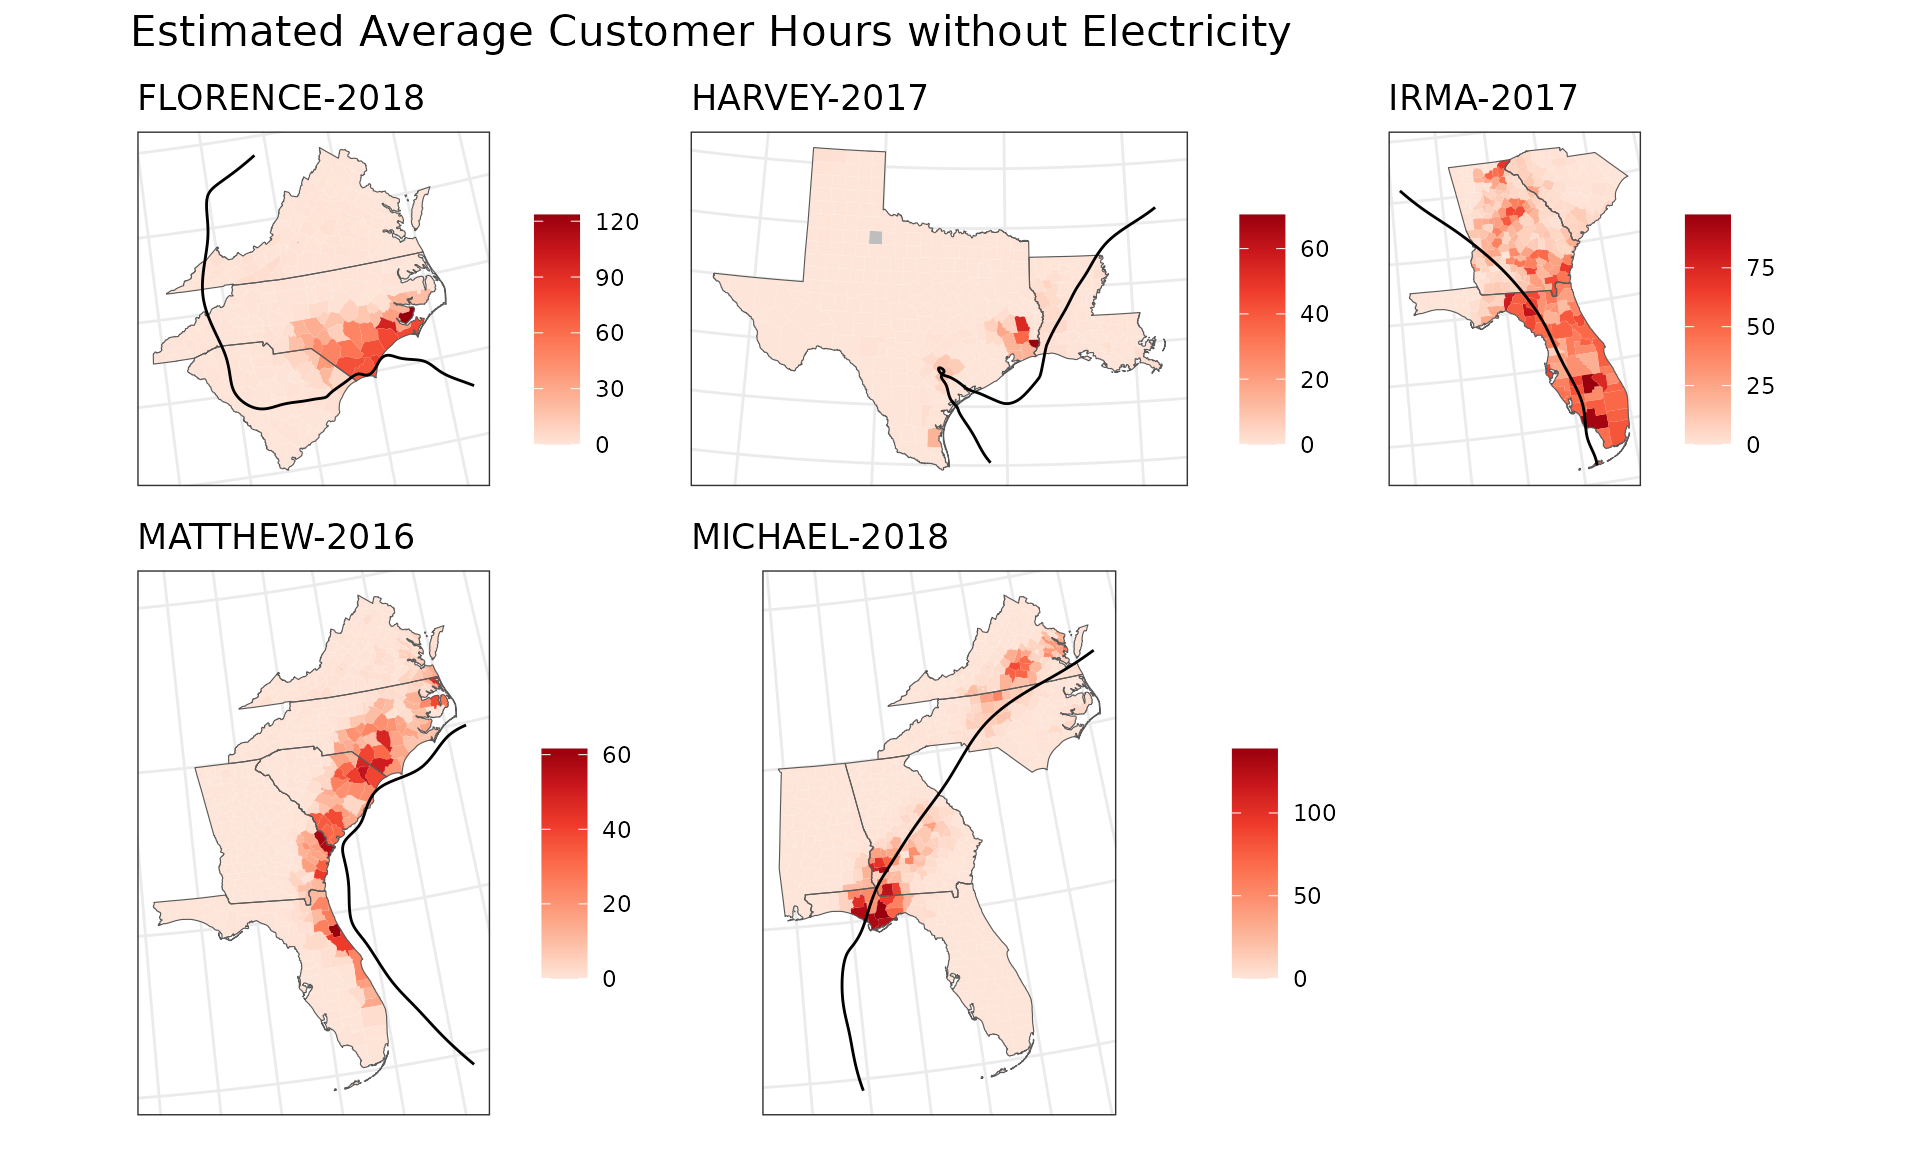
| Estimated Average Customer Hours without Electricity | ||||||||
| Storm | Mean | SD | Min | 25% Quantile | Median | 75% Quantile | Max | Distribution |
|---|---|---|---|---|---|---|---|---|
| FLORENCE-2018 | 5.238 | 16.277 | 0 | 0.148 | 0.370 | 1.122 | 123.445 | |
| HARVEY-2017 | 1.088 | 5.680 | 0 | 0.000 | 0.022 | 0.227 | 70.360 | |
| IRMA-2017 | 19.436 | 20.848 | 0 | 2.847 | 10.491 | 30.496 | 97.497 | |
| MATTHEW-2016 | 4.386 | 10.018 | 0 | 0.031 | 0.168 | 2.005 | 61.545 | |
| MICHAEL-2018 | 8.329 | 20.634 | 0 | 0.056 | 0.386 | 5.300 | 138.713 | |