Large Hurricane Analysis - Distance and Wind
top_15_wind.RmdProgram Background
Script name: Large Hurricane Analysis - Distance and Wind
Project name: ADRD and Hurricane Exposure
-
Program description:
Maximum wind was calculated for each tract using the
stormwindmodelpublished by Anderson at the geocentroid for each tract/zcta. -
Data:
- HURDAT2
Restrictions:
-
Outline of program/analysis:
- Specify all storms
- Download and process hurdat2 tracks
- Calculate geo-centroid for each tract/zcta
- Utilize stormwindmodel to produce wind exposure estimates
- Output imputed track geojsons for visualization
Author: Ryan Zomorrodi
Revisions
-
Input files
- All files are downloaded using R functions
- Cache is stored in
raw-data\hurdat2
-
Output files
tract/{storm_id}/distance_wind.csv-
zcta/{storm_id}/distance_wind.csvColumn Description geoid 2010 geographic identifier closest_datetime Date and time in UTC that storm is closest to the imputed storm track closest_dist Closest distance (km) to imputed central track highwind_datetime Date and time in UTC of maximum wind speed vmax_sust Maximum 10-m 1-min sustained wind for the tropical cyclone (m/s) vmax_gust Max 10-m 1-min gust wind experienced at grid point (m/s) sust_dur Duration of time a certain sustained wind was experienced at grid point (minutes) gust_dur Duration of time a certain gust wind was experienced at grid point (minutes) tract/{storm_id}/track_line.geojsonzcta/{storm_id}/track_line.geojsontract/{storm_id}/track_points.geojsonzcta/{storm_id}/track_points.geojson
Start Time
The following hurricanes were selected.
hur_info <- readRDS( "raw-data/RF1_Hurricanes_Final.rds")
# get fips codes for each state
fips_codes <- distinct(tigris::fips_codes, state, state_code)
hur_info$fips <- pmap(hur_info, function(states, ...) {
  fips_codes$state_code[match(states, fips_codes$state)]
})
Get hurdat2 info for each storm
exposhur:::download_newest_hurdat2(path = "raw-data/hurdat2")

hur_info$hurdat2 <- pmap(hur_info, function(hurricane, ...){
  hurdat  <- get_hurdat2(
    storm_id = hurricane,
    path = "raw-data/hurdat2"
  )

  list(
    start_date = min(hurdat$datetime),
    end_date = max(hurdat$datetime),
    hurdat = hurdat
  )
})
hur_info <- unnest_wider(hur_info, hurdat2)
Get states
hur_info$tracts_sf <- pmap(hur_info, function(start_date, fips, ...) {
  tracts_list <- map(fips,
    ~ tracts(state = .x, year = 2010, cb = TRUE)
  )
  bind_rows(tracts_list) %>%
    mutate(GEOID = str_sub(GEO_ID, -11)) %>% # get tract geoids
    filter(!st_is_empty(.)) %>% # remove tracts with empty geographies
    st_transform(4326) %>% # transform to WGS 84
    rename(geoid = GEOID) %>%
    st_centroid() # get geo-centroid of each tract
})

hur_info$zctas_sf <- pmap(hur_info, function(start_date, fips, ...) {
  zctas_list <- map(fips,
    ~ zctas(state = .x, year = 2010, cb = FALSE)
  )
  bind_rows(zctas_list) %>%
    filter(!st_is_empty(.)) %>% # remove zctas with empty geographies
    st_transform(4326) %>%
    rename(geoid = GEOID10) %>%
    st_centroid() # get geo-centroid of each zctas
})
Calculate interpolated track
hur_info$track <- pmap(hur_info, function(hurdat, ...) {
  calc_interpolated_track(hurdat)
})

pwalk(hur_info, function(track, hurricane, ...) {
  st_write(track, str_c("tract/", hurricane, "/track_points.geojson"))

  track %>%
    st_combine() %>%
    st_cast("LINESTRING") %>%
    st_write(str_c("tract/", hurricane, "/track_line.geojson"))
})

pwalk(hur_info, function(track, hurricane, ...) {
  st_write(track, str_c("zcta/", hurricane, "/track_points.geojson"))

  track %>%
    st_combine() %>%
    st_cast("LINESTRING") %>%
    st_write(str_c("zcta/", hurricane, "/track_line.geojson"))
})
Calculate closest distance
hur_info$tract_closest_dist <- pmap(hur_info, function(track, tracts_sf, ...) {
  calc_closest_dist(track, tracts_sf, geoid = "geoid")
})

hur_info$zcta_closest_dist <- pmap(hur_info, function(track, zctas_sf, ...) {
  calc_closest_dist(track, zctas_sf, geoid = "geoid")
})
Calculate wind speed
hur_info$tract_anderson_wind <- pmap(hur_info, function(hurdat, tracts_sf, ...) {
  calc_anderson_wind(hurdat, tracts_sf)
})

hur_info$zcta_anderson_wind <- pmap(hur_info, function(hurdat, zctas_sf, ...) {
  calc_anderson_wind(hurdat, zctas_sf)
})
Join output and write to file
pwalk(hur_info, function(tract_closest_dist, tract_anderson_wind, hurricane, ...) {
  full_join(tract_closest_dist, tract_anderson_wind, join_by(geoid)) %>%
    relocate(closest_date, .before = closest_dist) %>%
    rename(highwind_datetime = datetime, closest_datetime = closest_date) %>%
    write_csv(str_c("tract/", hurricane, "/distance_wind.csv"))
})

pwalk(hur_info, function(zcta_closest_dist, zcta_anderson_wind, hurricane, ...) {
  full_join(zcta_closest_dist, zcta_anderson_wind, join_by(geoid)) %>%
    relocate(closest_date, .before = closest_dist) %>%
    rename(highwind_datetime = datetime, closest_datetime = closest_date) %>%
    write_csv(str_c("zcta/", hurricane, "/distance_wind.csv"))
})
End Time
Visualizations
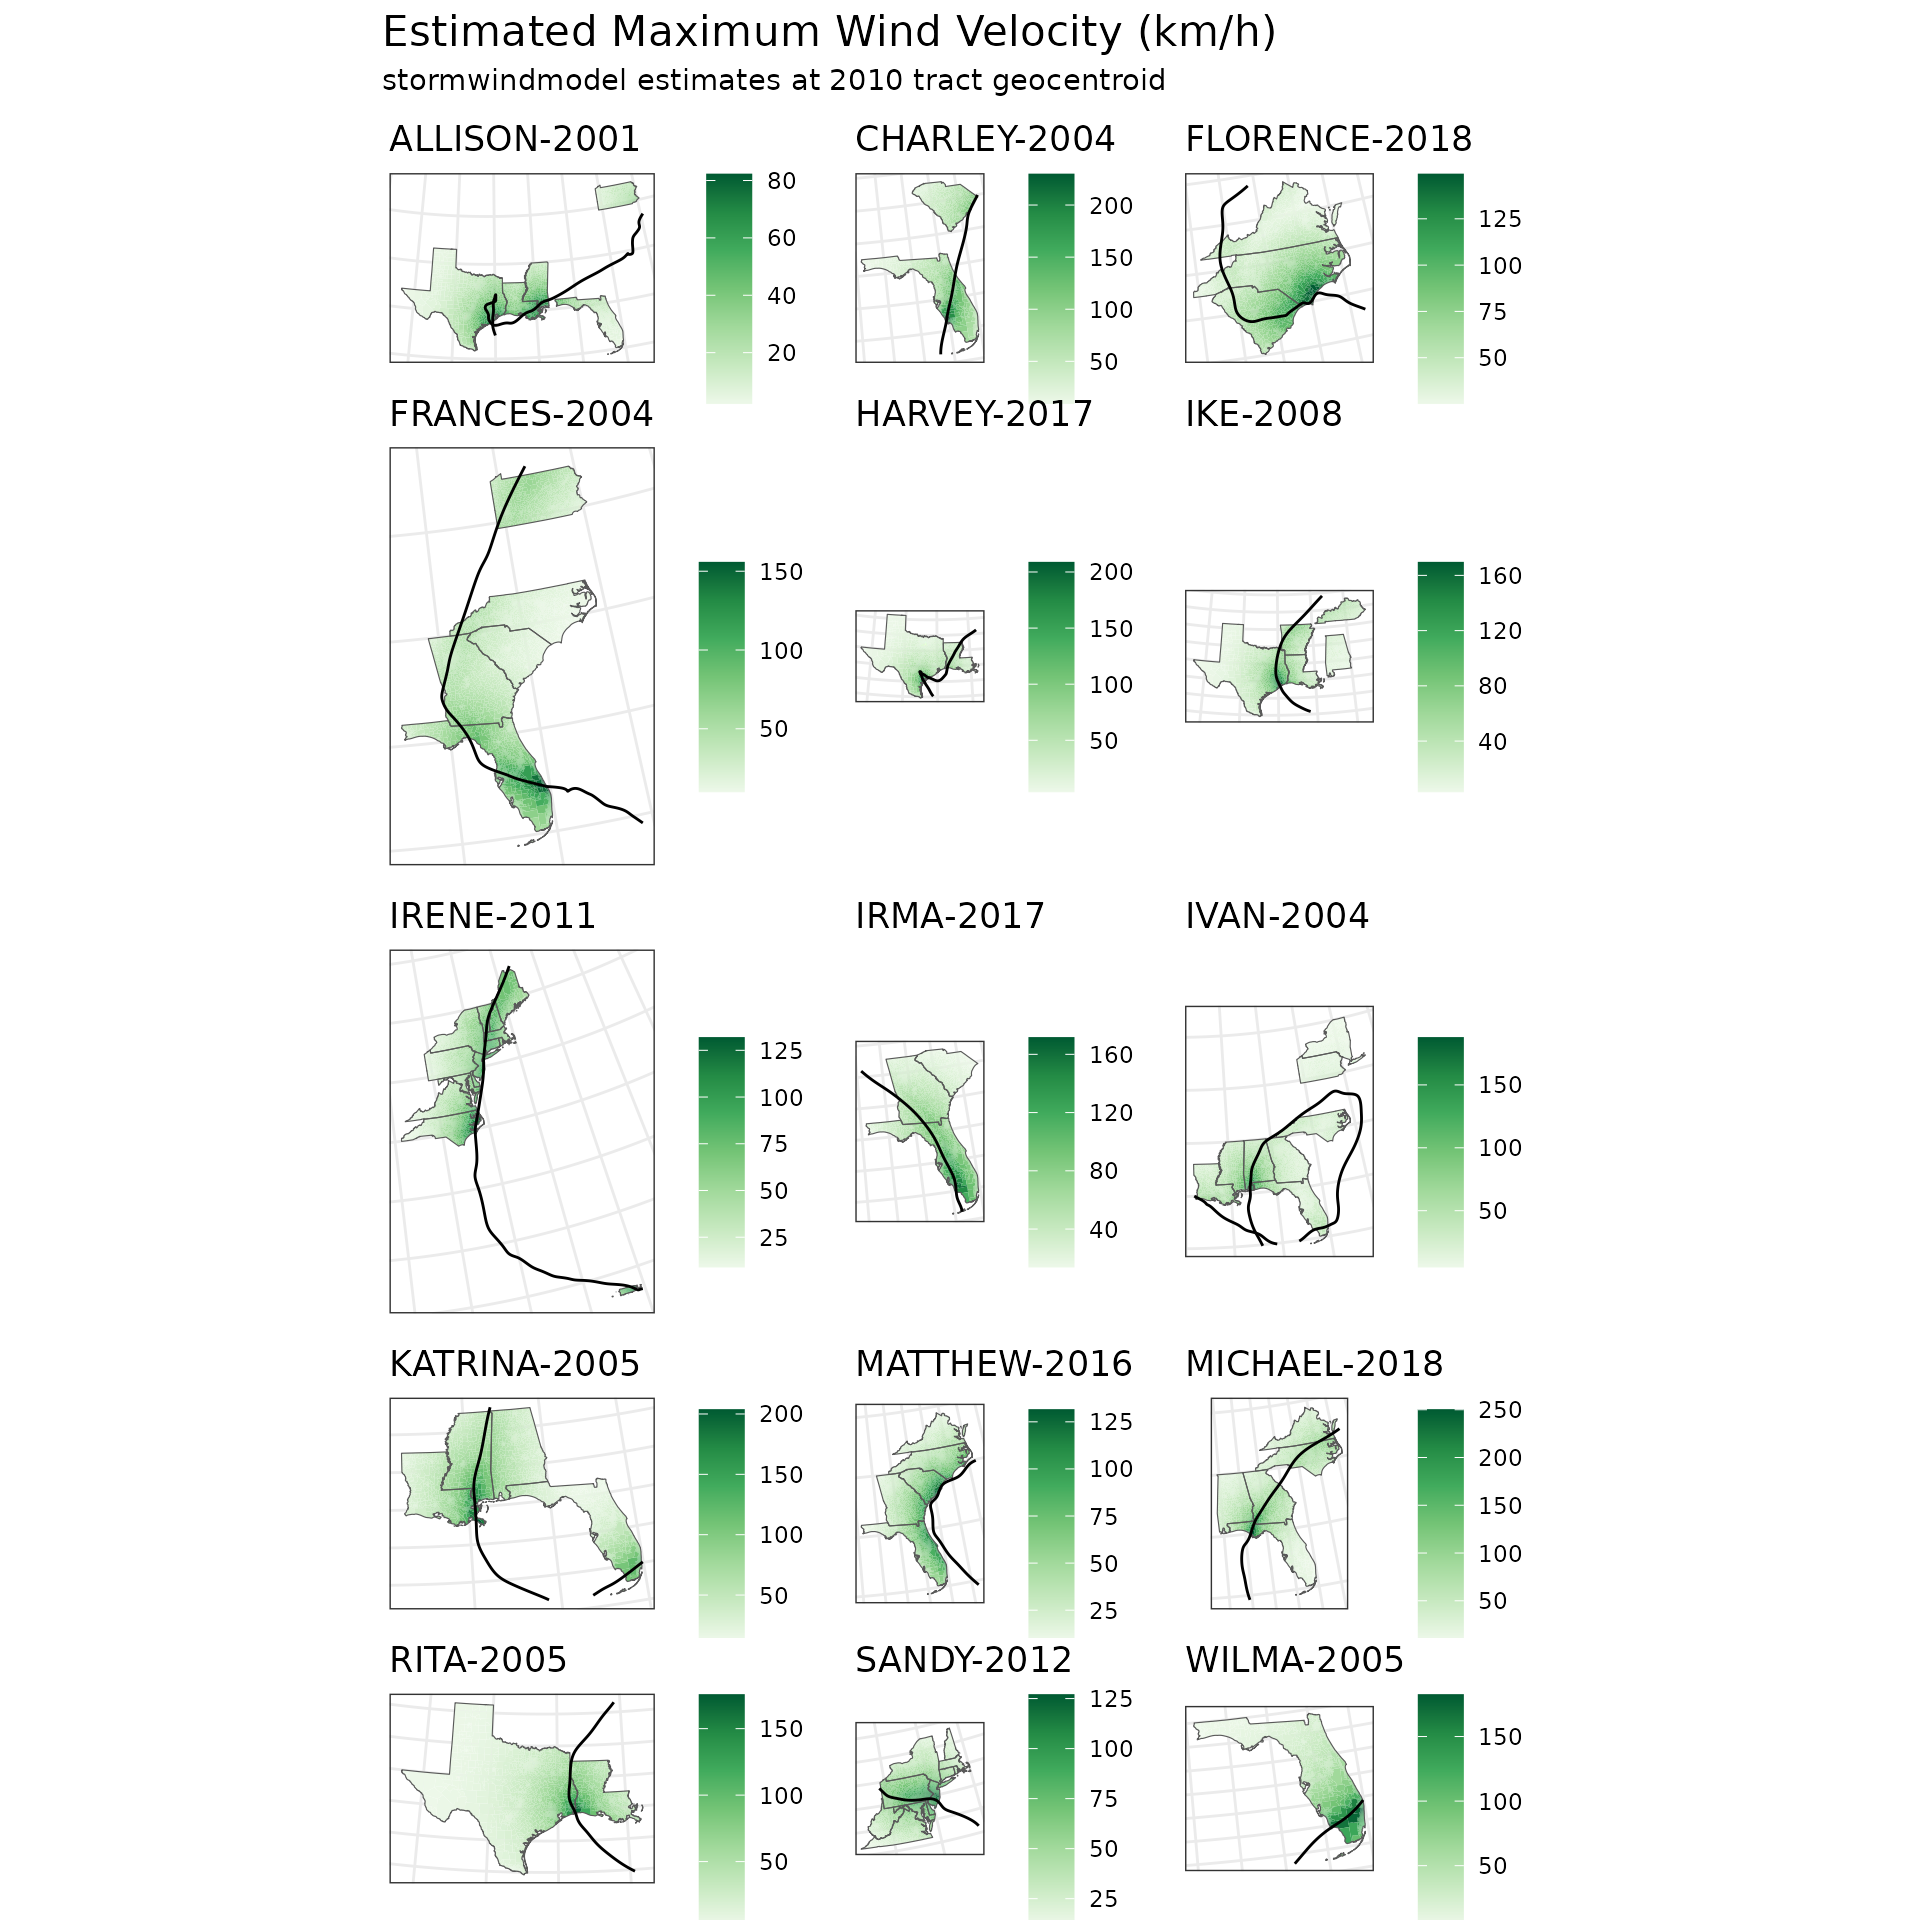
| Estimated Maximum Wind Velocity (km/h) | |||||||||
| stormwindmodel estimates at 2010 tract geocentroid | |||||||||
| Storm | Mean | SD | Min | 25% Quantile | Median | 75% Quantile | Max | Proportion 34+ knots | Distribution |
|---|---|---|---|---|---|---|---|---|---|
| ALLISON-2001 | 25.788 | 19.236 | 2.220 | 9.821 | 22.308 | 34.356 | 82.259 | 0.096 | |
| CHARLEY-2004 | 82.594 | 38.314 | 9.372 | 61.207 | 74.864 | 104.236 | 229.757 | 0.700 | |
| FLORENCE-2018 | 54.939 | 24.065 | 25.195 | 37.982 | 46.542 | 68.633 | 149.182 | 0.285 | |
| FRANCES-2004 | 49.652 | 28.276 | 9.961 | 26.541 | 43.254 | 70.405 | 155.705 | 0.286 | |
| HARVEY-2017 | 42.653 | 24.895 | 4.033 | 23.121 | 39.595 | 57.789 | 208.693 | 0.166 | |
| IKE-2008 | 48.213 | 36.008 | 3.212 | 25.803 | 40.482 | 51.648 | 169.524 | 0.181 | |
| IRENE-2011 | 64.229 | 25.675 | 9.007 | 44.521 | 66.186 | 88.897 | 131.869 | 0.546 | |
| IRMA-2017 | 64.582 | 33.614 | 13.870 | 33.130 | 70.543 | 87.528 | 171.575 | 0.546 | |
| IVAN-2004 | 29.284 | 20.513 | 5.153 | 18.484 | 23.176 | 35.746 | 187.711 | 0.046 | |
| KATRINA-2005 | 66.003 | 37.805 | 13.455 | 36.397 | 50.237 | 95.118 | 203.678 | 0.409 | |
| MATTHEW-2016 | 53.072 | 27.057 | 9.616 | 30.706 | 46.570 | 72.139 | 131.526 | 0.323 | |
| MICHAEL-2018 | 49.903 | 29.165 | 9.818 | 29.125 | 45.507 | 68.668 | 250.210 | 0.302 | |
| RITA-2005 | 41.564 | 27.803 | 2.925 | 24.638 | 31.641 | 62.374 | 175.649 | 0.247 | |
| SANDY-2012 | 66.865 | 25.770 | 12.256 | 41.173 | 68.184 | 86.468 | 127.014 | 0.565 | |
| WILMA-2005 | 75.566 | 47.825 | 4.688 | 42.593 | 52.651 | 119.569 | 182.511 | 0.438 | |
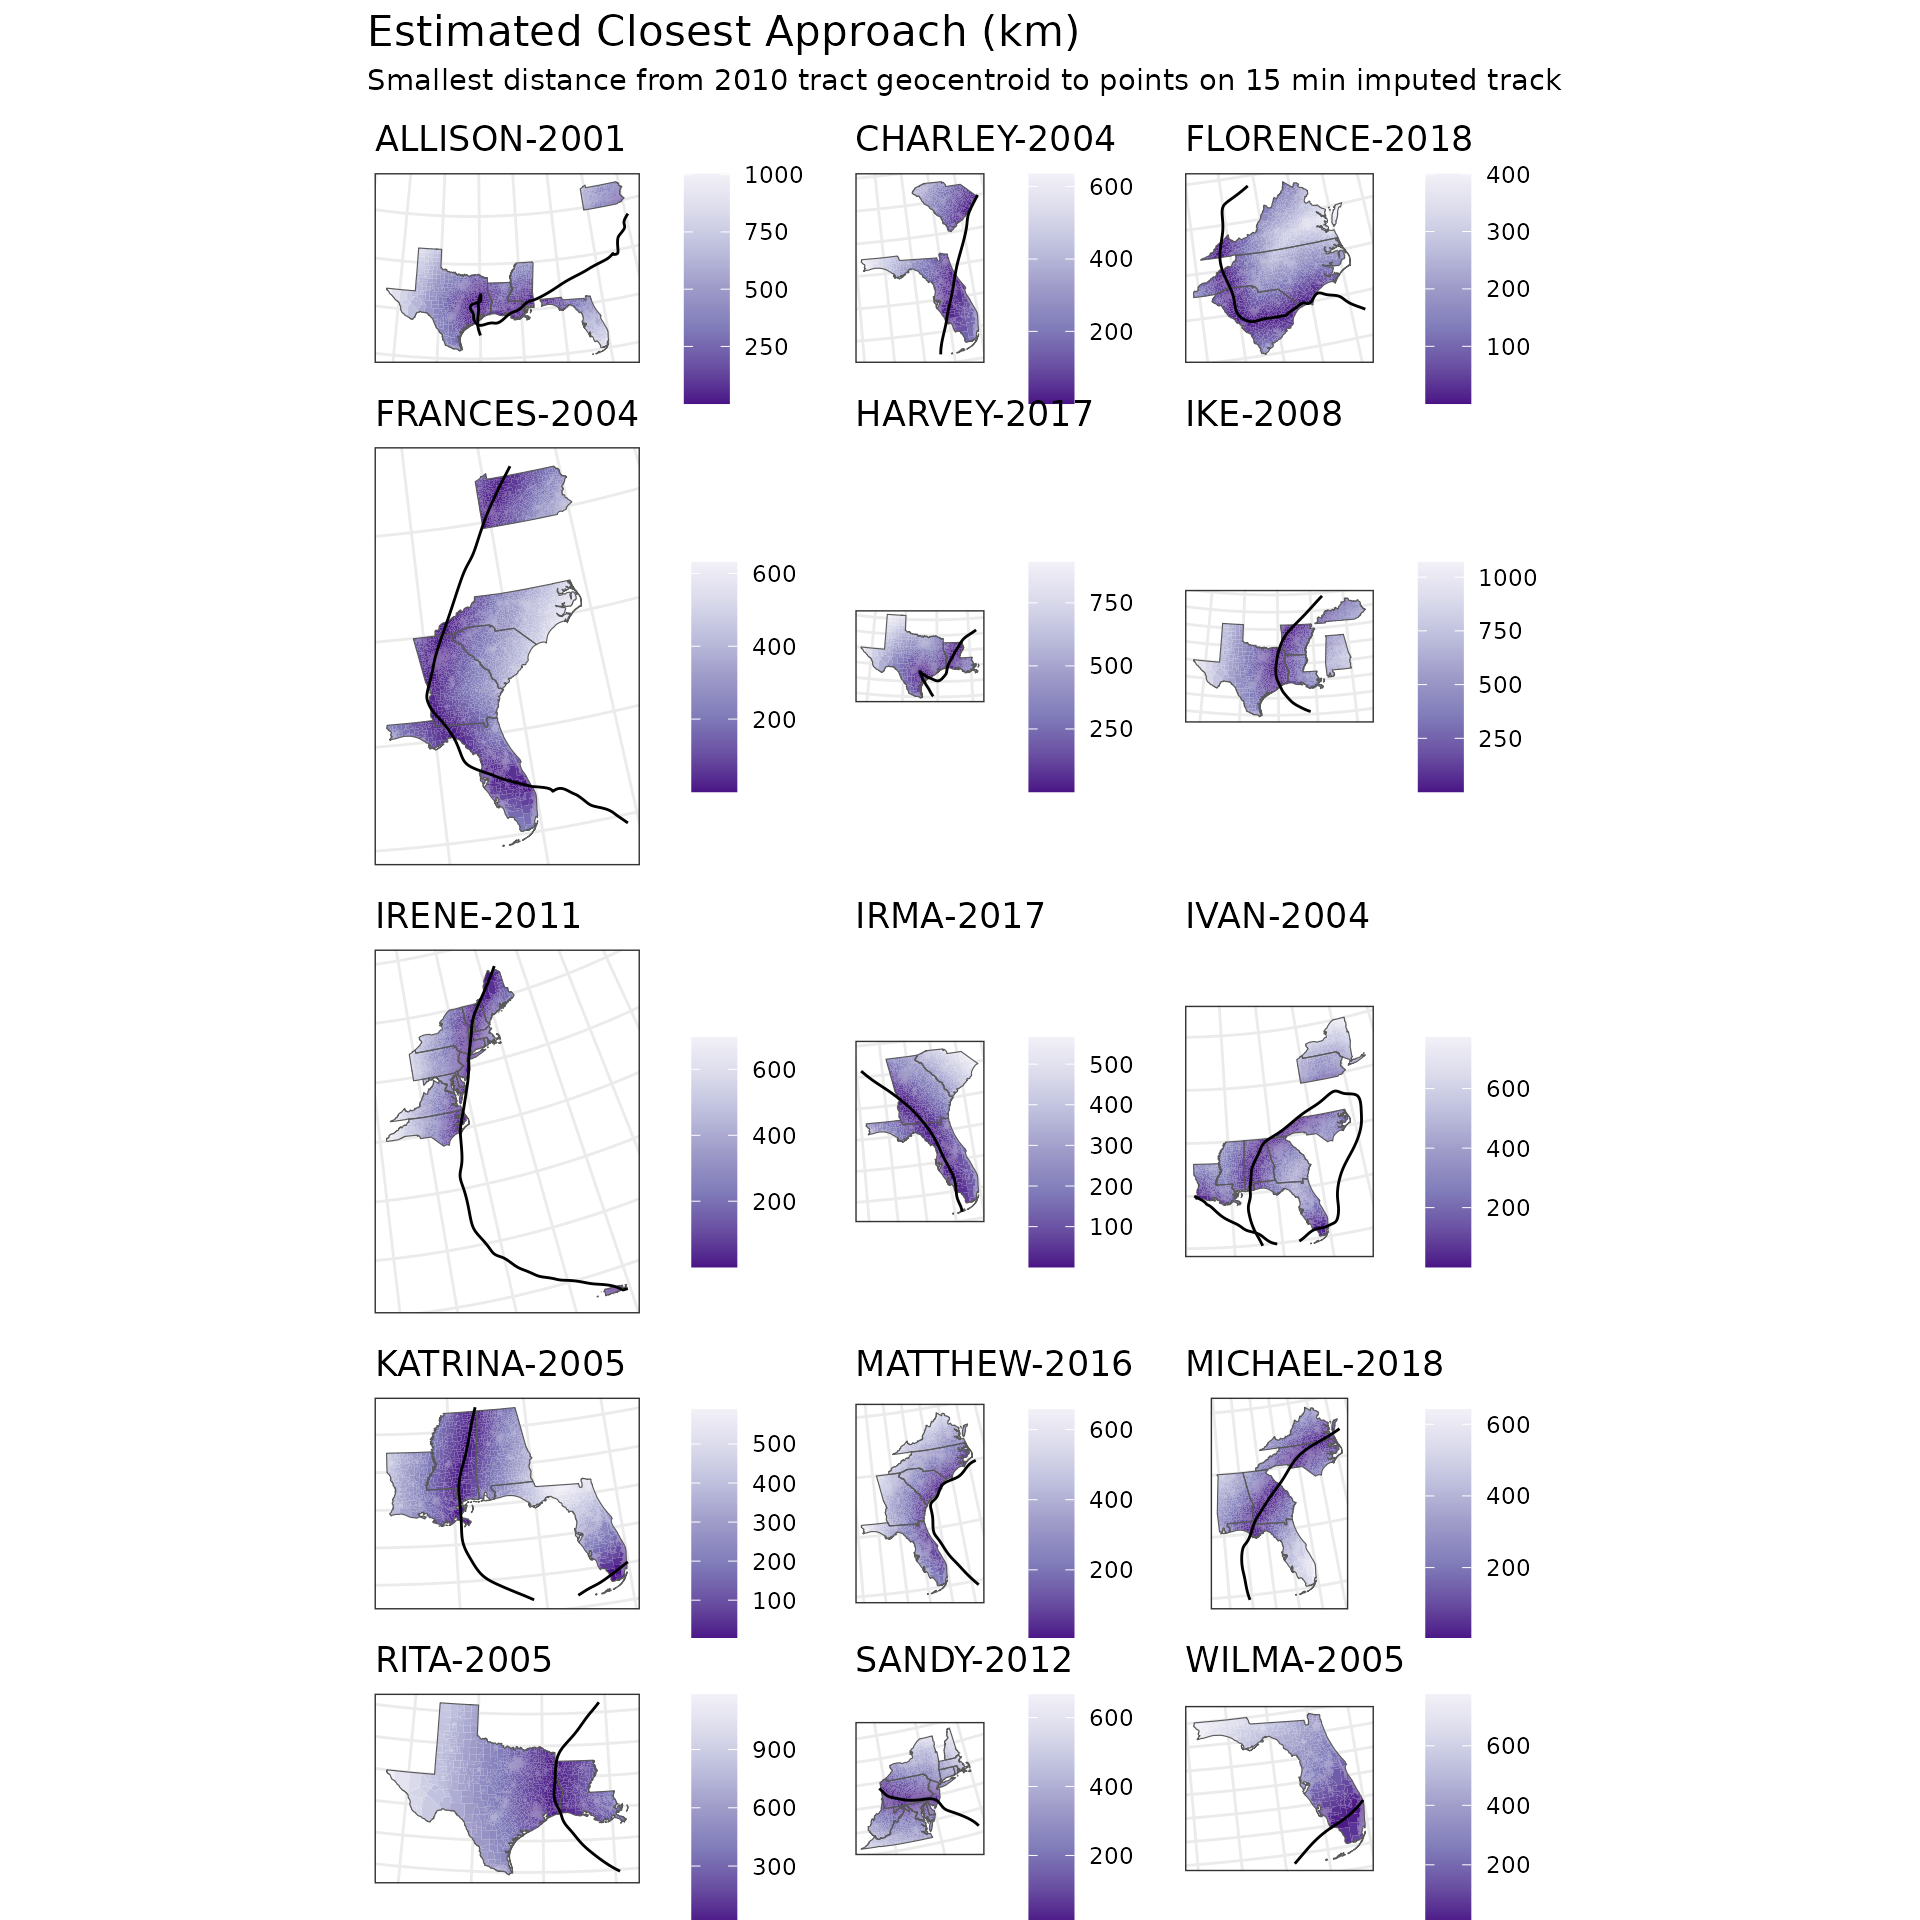
| Estimated Closest Approach (km) | ||||||||
| Smallest distance from 2010 tract geocentroid to points on 15 min imputed track | ||||||||
| Storm | Mean | SD | Min | 25% Quantile | Median | 75% Quantile | Max | Distribution |
|---|---|---|---|---|---|---|---|---|
| ALLISON-2001 | 338.441 | 246.730 | 0.069 | 154.922 | 255.680 | 515.935 | 1002.884 | |
| CHARLEY-2004 | 146.054 | 122.959 | 0.216 | 55.697 | 105.757 | 206.345 | 634.756 | |
| FLORENCE-2018 | 162.146 | 97.937 | 0.125 | 76.375 | 167.990 | 228.261 | 400.053 | |
| FRANCES-2004 | 176.385 | 138.003 | 0.151 | 53.609 | 144.778 | 276.453 | 630.581 | |
| HARVEY-2017 | 262.566 | 186.763 | 0.541 | 133.278 | 201.477 | 386.138 | 910.878 | |
| IKE-2008 | 298.520 | 215.277 | 0.730 | 147.279 | 255.453 | 414.476 | 1069.358 | |
| IRENE-2011 | 156.282 | 146.666 | 0.070 | 33.478 | 118.346 | 216.809 | 696.714 | |
| IRMA-2017 | 159.393 | 122.923 | 0.405 | 64.332 | 141.426 | 191.935 | 565.556 | |
| IVAN-2004 | 246.729 | 137.177 | 0.105 | 150.398 | 246.460 | 331.967 | 771.765 | |
| KATRINA-2005 | 201.392 | 142.318 | 0.118 | 64.503 | 188.290 | 309.571 | 588.148 | |
| MATTHEW-2016 | 257.748 | 132.837 | 2.357 | 151.113 | 248.476 | 357.505 | 657.001 | |
| MICHAEL-2018 | 250.988 | 186.092 | 0.201 | 99.333 | 212.237 | 381.521 | 641.120 | |
| RITA-2005 | 321.107 | 218.944 | 0.648 | 164.012 | 281.815 | 398.255 | 1183.030 | |
| SANDY-2012 | 182.828 | 131.410 | 0.562 | 84.768 | 142.204 | 284.651 | 666.805 | |
| WILMA-2005 | 207.888 | 166.815 | 0.462 | 71.454 | 212.564 | 261.597 | 772.423 | |