Large Hurricane Analysis - Precipitation
top_15_precipitation.RmdProgram Background
Script name: Large Hurricane Analysis - Precipitation
Project name: ADRD and Hurricane Exposure
-
Program description:
Amount of precipitation was calculated for every day specified within the HURDAT2 plus an additional 2 days after. nClimGrid raster data was used to calculate an areal mean precipitation for all tracts/zctas.
-
Data:
- HURDAT2 - to get storm dates
- nClimGrid-Daily
Restrictions:
-
Outline of program/analysis:
- Specify all storms
- Download and process hurdat2 tracks
- Download nClimGrid data for duration of storm plus 2 days after
- Calculate areal mean precipitation
Author: Ryan Zomorrodi
Revisions
-
Input files
- All files are downloaded using R functions
- Cache is stored in
raw-data\nClimGrid
-
Output files
tract/{storm id}/daily_prcp.csv-
zcta/{storm id}/daily_prcp.csvColumn Description geoid2010 geographic identifier dateDate in UTC mean_prcpMean areal precipitation (mm) for the specified
geoidandtractNote: there may be NAs for a small number of coastline tract which were not entirely covered by nClimGrid
The following hurricanes were selected.
hur_info <- readRDS("raw-data/RF1_Hurricanes_Final.rds")
# get fips codes for each state
fips_codes <- distinct(tigris::fips_codes, state, state_code)
hur_info$fips <- pmap(hur_info, function(states, ...) {
  fips_codes$state_code[match(states, fips_codes$state)]
})
Get hurdat2 info for each storm
exposhur:::download_newest_hurdat2(path = "raw-data/hurdat2")

hur_info$hurdat2 <- pmap(hur_info, function(hurricane, ...){
  hurdat  <- get_hurdat2(
    storm_id = hurricane,
    path = "raw-data/hurdat2"
  )

  list(
    start_date = min(hurdat$datetime),
    end_date = max(hurdat$datetime),
    hurdat = hurdat
  )
})
hur_info <- unnest_wider(hur_info, hurdat2)
Get states
hur_info$tracts_sf <- pmap(hur_info, function(start_date, fips, ...) {
  tracts_list <- map(fips,
    ~ tracts(state = .x, year = 2010, cb = TRUE)
  )
  bind_rows(tracts_list) %>%
    mutate(GEOID = str_sub(GEO_ID, -11)) %>% # get tract geoids
    filter(!st_is_empty(.)) %>% # remove tracts with empty geographies
    st_transform(4326) %>% # transform to WGS 84
    rename(geoid = GEOID)
})

hur_info$zctas_sf <- pmap(hur_info, function(start_date, fips, ...) {
  zctas_list <- map(fips,
    ~ zctas(state = .x, year = 2010, cb = FALSE)
  )
  bind_rows(zctas_list) %>%
    filter(!st_is_empty(.)) %>% # remove zctas with empty geographies
    st_transform(4326) %>%
    rename(geoid = GEOID10)
})
Get nClimGrid
hur_info$nClimGrid <- pmap(hur_info, function(start_date, end_date, ...) {
  get_nClimGrid(
    interval = interval(start_date, end_date + days(2)),
    path = "raw-data/nClimGrid"
  )["prcp"]
})
Calculate daily precipitation
hur_info$tract_prcp_daily_avg <- pmap(hur_info, function(nClimGrid, tracts_sf, ...) {
  calc_daily_avgs(
    nClimGrid = nClimGrid,
    geography = tracts_sf,
    geoid = "geoid"
  )
})

pwalk(hur_info, function(tract_prcp_daily_avg, hurricane, ...) {
  write_csv(tract_prcp_daily_avg, str_c("tract/", hurricane, "/daily_prcp.csv"))
})

hur_info$zcta_prcp_daily_avg <- pmap(hur_info, function(nClimGrid, zctas_sf, ...) {
  calc_daily_avgs(
    nClimGrid = nClimGrid,
    geography = zctas_sf,
    geoid = "geoid"
  )
})

pwalk(hur_info, function(zcta_prcp_daily_avg, hurricane, ...) {
  write_csv(zcta_prcp_daily_avg, str_c("zcta/", hurricane, "/daily_prcp.csv"))
})
End Time
Visualizations
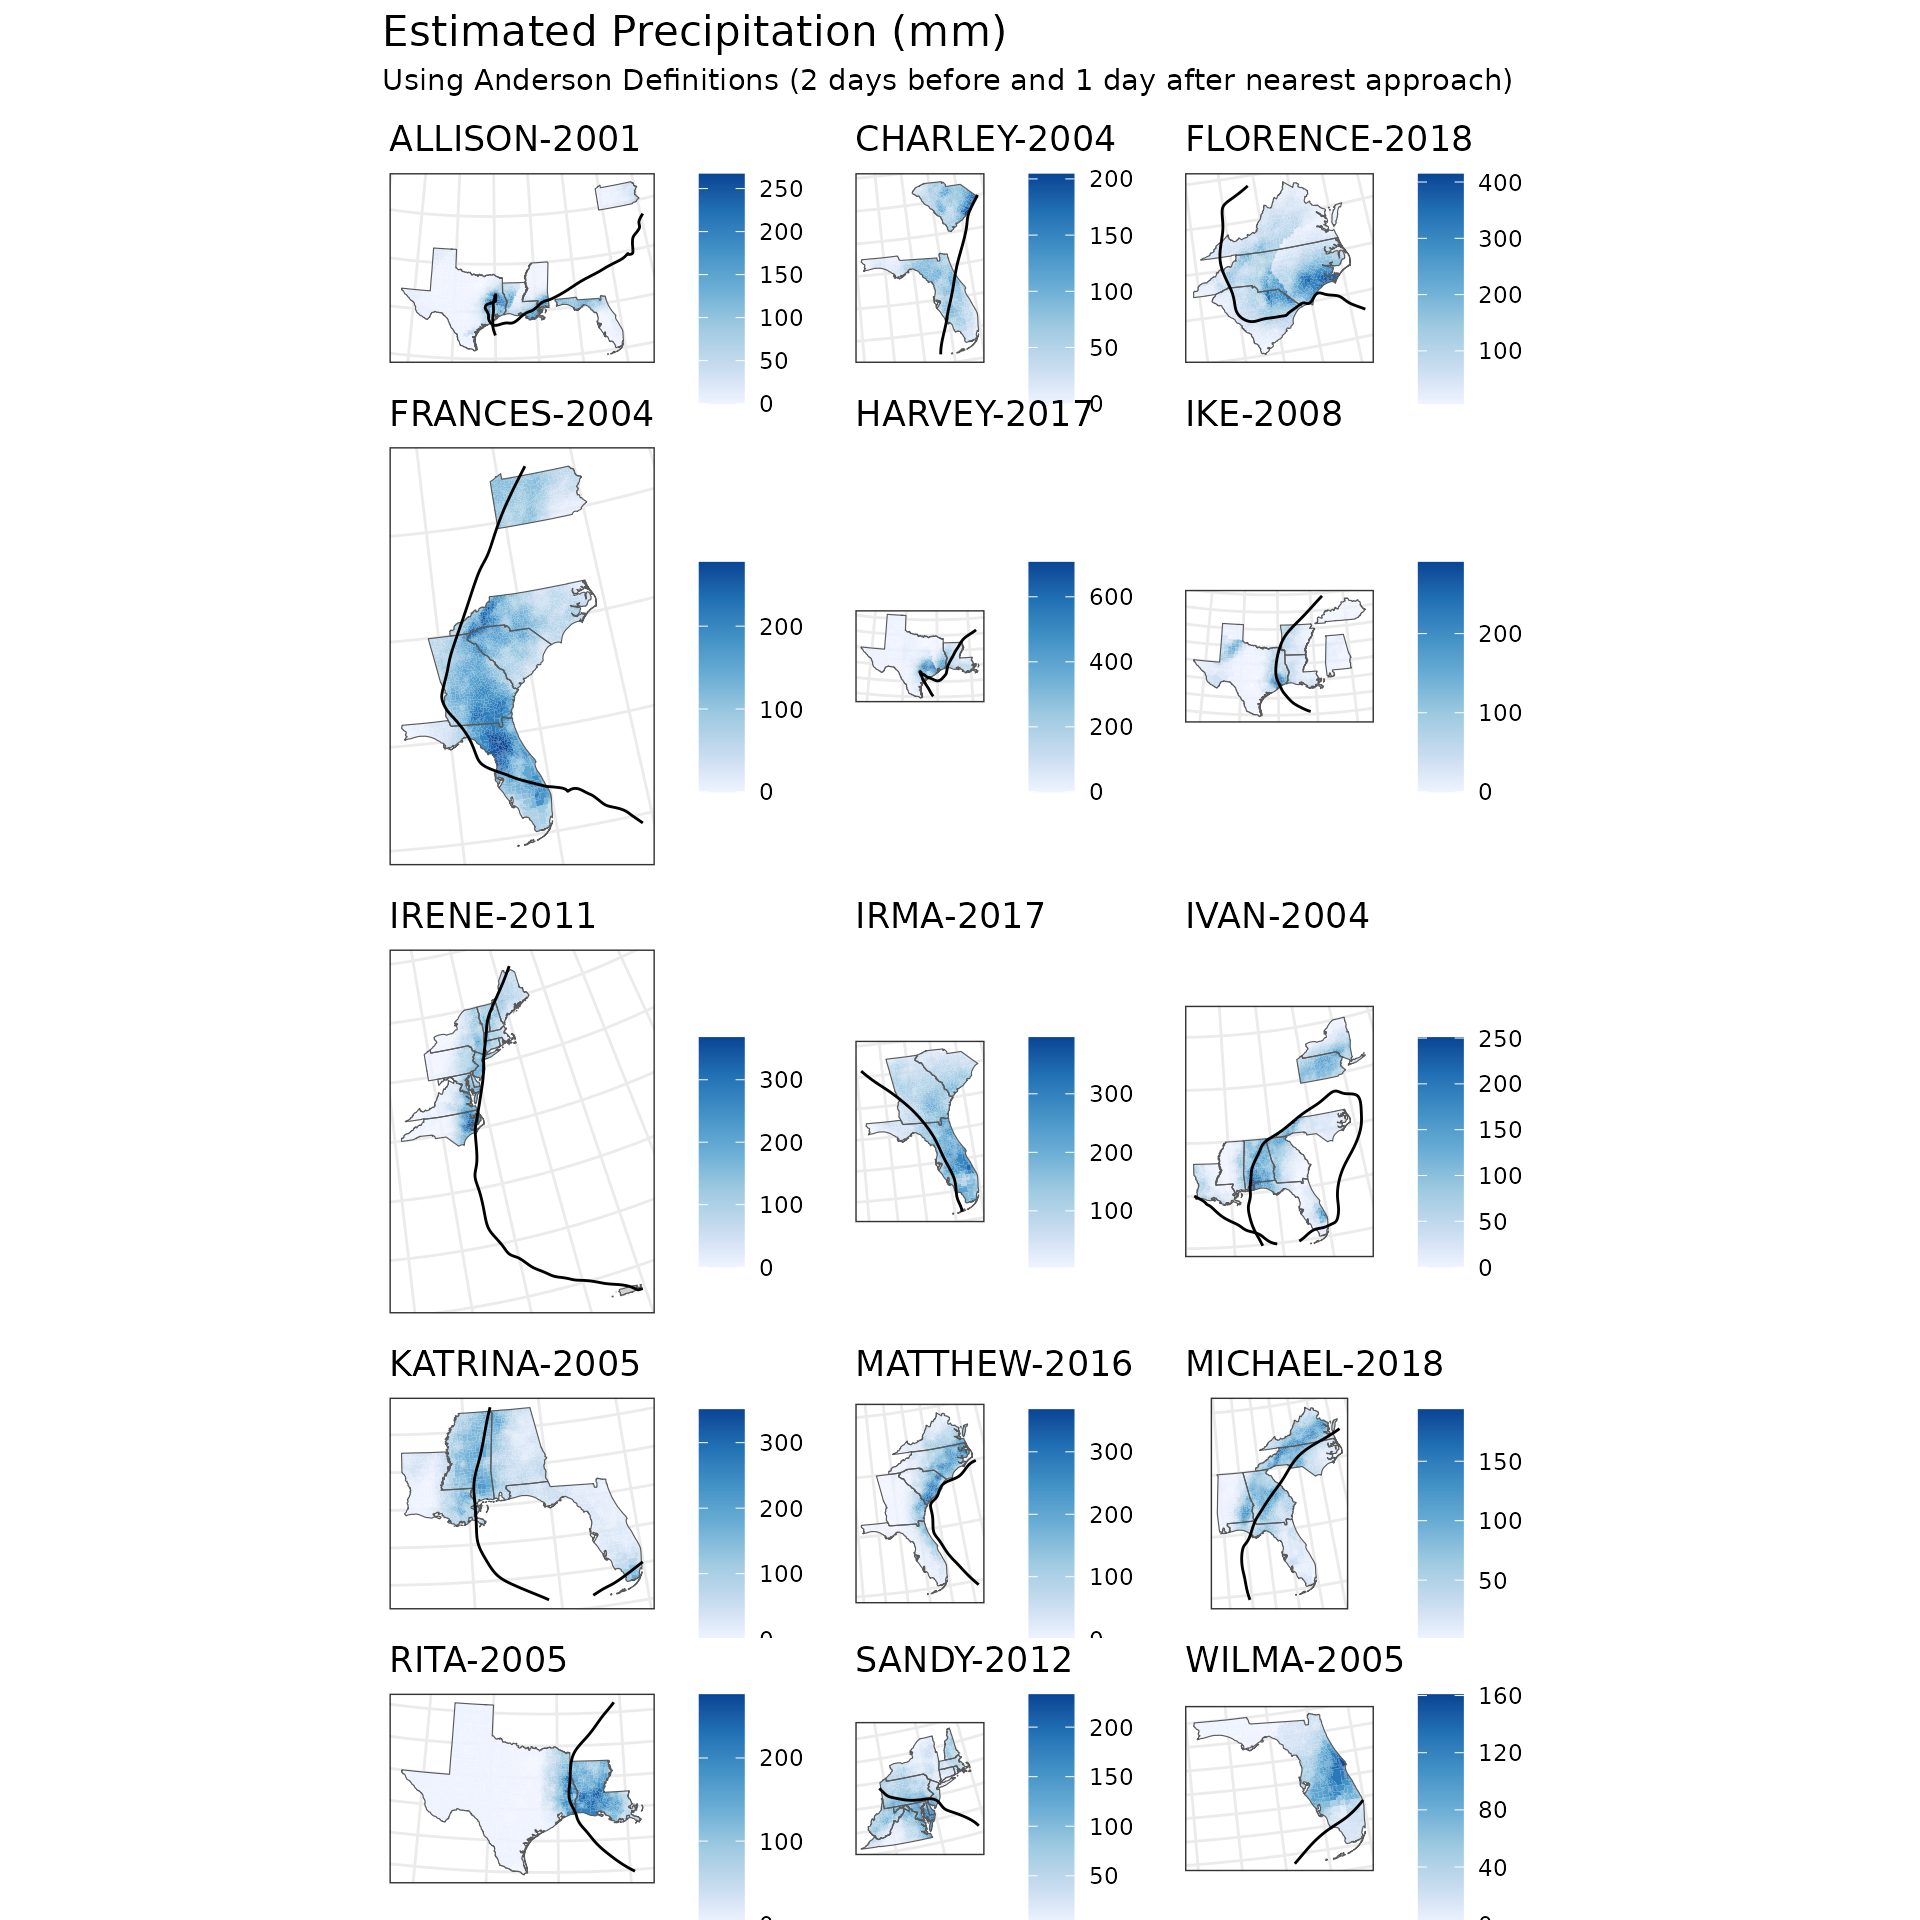
| Estimated Precipitation (mm) | |||||||||
| Using Anderson Definitions (2 days before and 1 day after nearest approach) | |||||||||
| Storm | Mean | SD | Min | 25% Quantile | Median | 75% Quantile | Max | Proportion 75+ mm | Distribution |
|---|---|---|---|---|---|---|---|---|---|
| ALLISON-2001 | 35.554 | 50.258 | 0.000 | 0.000 | 7.942 | 62.555 | 266.911 | 0.178 | |
| CHARLEY-2004 | 55.196 | 33.810 | 0.000 | 19.547 | 54.864 | 70.348 | 204.354 | 0.212 | |
| FLORENCE-2018 | 92.329 | 73.997 | 6.286 | 34.434 | 72.593 | 127.828 | 414.180 | 0.491 | |
| FRANCES-2004 | 101.366 | 57.784 | 0.000 | 59.478 | 98.321 | 135.248 | 277.157 | 0.683 | |
| HARVEY-2017 | 154.009 | 203.869 | 0.000 | 10.032 | 78.329 | 187.278 | 706.293 | 0.511 | |
| IKE-2008 | 43.605 | 72.696 | 0.000 | 2.153 | 13.393 | 35.817 | 290.219 | 0.158 | |
| IRENE-2011 | 121.648 | 82.651 | 0.000 | 46.219 | 127.422 | 198.781 | 367.668 | 0.665 | |
| IRMA-2017 | 144.078 | 71.503 | 3.887 | 86.598 | 136.486 | 192.758 | 396.242 | 0.819 | |
| IVAN-2004 | 60.214 | 49.524 | 0.000 | 21.803 | 42.498 | 97.653 | 250.620 | 0.329 | |
| KATRINA-2005 | 59.749 | 47.379 | 0.000 | 23.230 | 42.142 | 90.638 | 350.554 | 0.289 | |
| MATTHEW-2016 | 70.584 | 78.303 | 0.000 | 8.935 | 35.734 | 109.224 | 367.656 | 0.363 | |
| MICHAEL-2018 | 48.546 | 39.067 | 0.346 | 14.675 | 34.607 | 82.957 | 193.468 | 0.293 | |
| RITA-2005 | 35.737 | 59.568 | 0.000 | 0.000 | 0.000 | 45.985 | 276.335 | 0.173 | |
| SANDY-2012 | 67.584 | 47.566 | 1.198 | 26.250 | 56.852 | 92.555 | 232.859 | 0.365 | |
| WILMA-2005 | 54.684 | 36.029 | 0.000 | 27.131 | 48.037 | 82.331 | 160.694 | 0.281 | |